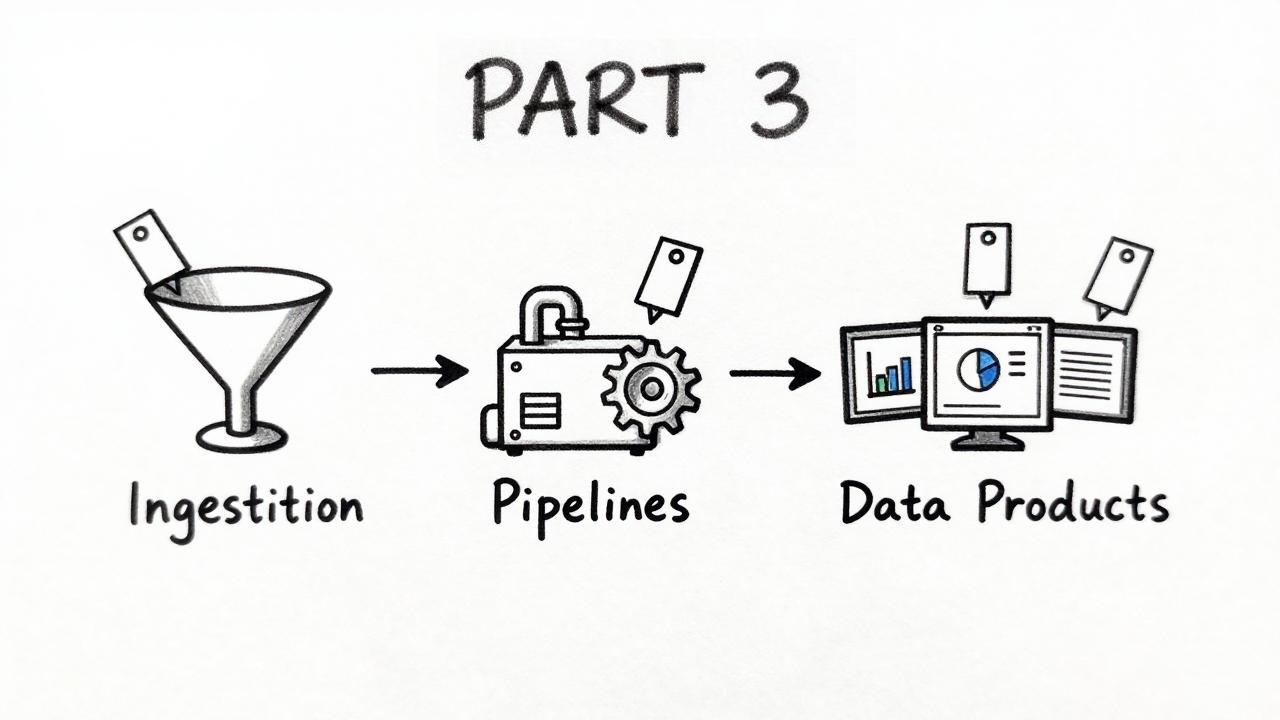
Azure tagging strategy, part 3: cost per data product on Databricks and Fabric

The invoice says "Azure Databricks: CHF X". Which product caused it? Azure tags alone can't answer that, because Databricks and Microsoft Fabric each add their own tag system. This is part 3 of 3. It shows which tags reach which billing data, how we get one CHF figure per data product, and where Fabric tags fit. It uses the data-product tag and the Terraform module from part 2.
- Databricks and Fabric bring a second tag system. Databricks compute tags reach billing data. Fabric tags don't reach Azure billing; they help with discovery and feed your own cost allocation.
- The concept is the same for both: export the Azure cost data, load it into tables, attribute the cost lines to products, report. Export and ingestion are already described in my Databricks cost control series.
- Look at your own cost export first. If the cost lines carry
data-product, Cost Management answers. If not, you need usage data from the platform: DBUs (Databricks Units) for Databricks, capacity unit consumption for Fabric. - Databricks: add VM cost from Cost Management and the Databricks charges split by DBU share, per workspace. The shares always add up to the invoice, so check the assumptions against independent data.
- Fabric: the capacity is the smallest unit in the Azure bill. Separate capacities per cost center are the simplest split.
- Report shared cost as its own line. Allocate it only when someone needs full cost per product.
- Part 1: what to tag, what not, and where tags can live
- Part 2: from alert to ticket with Terraform and ITSM tags
- Part 3: cost per data product on Databricks and Fabric (this post)
The common concept: cost per product from an export
Azure bills resources, not data products. A cost line only knows its resource, so a product is only visible if a tag on that resource says so. For Databricks and Fabric the answer has the same four steps, and most of it is already described in my Databricks cost control series.
- Export. Cost Management writes the cost data of a scope, for example a subscription, to a storage account on a schedule. Part 2 of the Databricks cost control series sets this up with Terraform and explains which export type to choose. Databricks and Fabric capacity lines end up in the same dataset.
- Ingestion. Load the files into tables. The same post does this with Auto Loader into Unity Catalog. Tags arrive as JSON in the
Tagscolumn. - Attribution. Open your export, filter on the meters of the platform and check which lines carry
data-product. Documentation tells you what should happen. Only your own data shows what does.- Lines carry the tag: the export already gives invoiced CHF per product. There is nothing to allocate.
- Lines don't carry it: you need usage data from the platform and a share per product. The platform sections below show which data that is.
- Everything without a product is shared cost.
- Report. Where to show the result depends on who reads it.
Shared costs
Not every cost belongs to one product. I sort shared cost into three groups:
| Group | Examples | How to handle it |
|---|---|---|
| Belongs to one product | Storage accounts, Key Vaults or Event Hubs deployed per product | Tag with data-product through the module. Nothing to allocate. |
| Shared, but measurable per product | Job compute in a shared Databricks workspace, workspaces on a shared Fabric capacity | Platform usage data, see the sections below. |
| Shared platform | Workspace networking, metastore storage, monitoring, platform jobs | Report as its own shared line. |
Start with the separate line. This is called showback: you show the cost without charging it. The FinOps Framework notes that managing shared costs can be complex and that many organizations start without allocating them.
If management wants the full cost per product, Cost Management offers cost allocation rules. A rule moves the cost of a source (subscription, resource group or tag) to targets. You split it evenly, by percentage, or in proportion to the cost of the targets. Three limits apply:
- Rules work on cost, not on usage. They can't use usage data such as a DBU share or capacity unit consumption.
- Allocated amounts no longer match the invoice. Filter the rules out when you reconcile.
- A rule can take up to 24 hours to apply.
Check that your agreement type supports cost allocation rules before you plan around them.
Where to show the result
The AI/BI dashboard from part 2 of the cost control series already shows Azure cost next to the Databricks system tables. Its gold layer groups infrastructure cost by resource group and meter category. To show cost per product, add the data-product tag from the Tags column as a column.
The right place for the result depends on who reads it:
- Product teams and the platform team: that dashboard for Databricks, because VM and DBU cost sit in one dataset. For Fabric, see the ready-made option in the Fabric section.
- Finance and management: Power BI. Microsoft recommends exporting cost data to a storage account and reporting from there. The FinOps toolkit ships Power BI reports for it.
- Budgets and alerts: Quick Azure Cost Management: Budget and Notifications shows how to create Azure budgets with Bicep, the Azure CLI and the portal. A budget per product needs a filter on the
data-producttag, so check the filter options for your scope. For unusual Databricks spend, see SQL alerts in part 3 and budget control and spend blocking in part 4 of the series.
Where Databricks and Fabric differ
Both platforms have two tag worlds: Azure resource tags on the control plane and platform-native tags. Mixing them up is the most common source of "why don't my tags show up in the cost report?". The cost side is where the platforms differ:
| Databricks | Fabric | |
|---|---|---|
| Smallest cost unit in the Azure bill | VMs in the managed resource group (classic compute) and the Databricks meters per workspace | The capacity |
| Usage data below that unit | system.billing.usage: DBUs with custom_tags | Capacity Metrics app: capacity unit seconds per workspace and item |
| Typical way to split cost | DBU share per workspace, with job and cluster tags | One capacity per cost center, or your own allocation based on capacity unit consumption |
Databricks
- Workspace tags are combined with cluster or pool tags and the default tags, then applied to the VMs in the managed resource group. Your workspace's ITSM tags show up again on every cluster VM, so in a shared workspace they name the platform, never a product.
x_prefix on collision: a custom tag with the same key as a default tag is propagated asx_<key>. So avoid custom keys likeVendor,Creator,ClusterName,JobId,RunName.- The 50-tag limit applies to the VM. If the aggregated tags exceed it, Databricks ignores
x_tags first, then others, in alphabetical order. A generous workspace tag set leaves less room for cluster tags. - Pools are special: clusters created from a pool only get workspace + pool tags on their VMs. A job's
data-producttag doesn't reach the VMs of a pooled cluster, so VM cost of a pool shared by several products can't be split by tag. The DBU usage records still carry the cluster tags. Use one pool per product, or job compute without a pool, for workloads whose VM cost you want to attribute. - Other limits: stricter allowed characters, and workspace tag changes take up to an hour and reach existing compute only after a restart. See Use tags to attribute and track usage.
Conflicting tags in compute policies don't get the x_ treatment. They make cluster creation fail with an invalid settings error.
Our recommendation for a shared workspace with many products:
| Level | Tag type | Purpose |
|---|---|---|
| Workspace | Azure tags from the central module with shared = true (itsm-*, env, managed-by, no data-product) | ITSM routing to the platform team; flows to all VMs |
| Job / cluster | Databricks custom tags: data-product (from the module output), layer (bronze, silver, gold) | Cost per data product and layer, same key and value as on Azure resources |
| Compute policy | Fixed custom tags | Nobody can launch untagged classic compute |
| Serverless | Serverless usage policy per product, with the same data-product tag | Cost per data product for serverless usage. The tags reach system.billing.usage; check whether they reach your Cost Management export |
- Job tags (Terraform)
- Compute policy
- DBU share per product (SQL)
Job tags propagate to the job cluster. The value comes from the tag module, not from a hand-typed variable:
resource "databricks_job" "silver" {
  name = "sales-forecast-silver-${var.identifier}"
  # ...
  tags = {
    "data-product" = module.tags.data_product
    layer          = "silver"
  }
}
Enforce tags so nobody can launch untagged compute. One policy per product; the fixed value is the module's data_product output:
{
  "custom_tags.data-product": { "type": "fixed", "value": "sales-forecast" },
  "custom_tags.layer":        { "type": "allowlist", "values": ["bronze", "silver", "gold"] }
}
Each product's share of last month's Databricks usage per workspace, weighted by list price so that a serverless DBU and a jobs DBU aren't counted as equal. system.billing.usage covers the whole account, so every environment's workspace shows up here. The share must be calculated within each workspace, never across them. list_prices is in USD at list price, not your invoice, so use the result only as a ratio (next section):
WITH priced AS (
  SELECT
    u.workspace_id,
    u.custom_tags['data-product'] AS data_product,
    u.usage_quantity AS dbus,
    u.usage_quantity * lp.pricing.effective_list.default AS list_usd
  FROM system.billing.usage u
  JOIN system.billing.list_prices lp
    ON  u.cloud = lp.cloud
    AND u.sku_name = lp.sku_name
    AND u.usage_end_time >= lp.price_start_time
    AND (lp.price_end_time IS NULL OR u.usage_end_time < lp.price_end_time)
  WHERE u.usage_date >= date_trunc('MONTH', add_months(current_date(), -1))
    AND u.usage_date <  date_trunc('MONTH', current_date())
)
SELECT
  workspace_id,
  coalesce(data_product, 'shared')                                  AS data_product,
  SUM(dbus)                                                         AS dbus,
  SUM(list_usd)                                                     AS list_usd,
  SUM(list_usd) / SUM(SUM(list_usd)) OVER (PARTITION BY workspace_id) AS share
FROM priced
GROUP BY 1, 2
ORDER BY workspace_id, share DESC;
The shares add up to 1 within each workspace.
From DBUs to CHF
How DBUs and prices add up to a Databricks charge is explained in Controlling Databricks Costs on Azure. The bill has two parts, and each part can be visible in a different place:
| Part of the bill | Where the money is | Where the product is |
|---|---|---|
| Infrastructure of classic compute (VMs in the managed resource group) | Cost Management, in CHF | data-product on the VM tags |
| Databricks charges (DBUs, classic and serverless) | Cost Management, in CHF, on the Databricks meters | system.billing.usage, as DBUs; possibly also on the Cost Management lines (see below) |
For Databricks, the documentation says tags propagate to cost analysis reports, but it names the VMs. Whether the DBU lines carry the tag in your tenant is the question from step 3 above. Tags arrive in the export's Tags column.
Serverless: check it separately. It runs without VMs in your managed resource group. Its tags always reach system.billing.usage, but they may not reach the export, so the share method is the fallback.
For the parts the export can't answer, we add the two parts per product, per workspace and per month. With DEV, INT and PRD that means three separate allocations:
- Infrastructure: in Cost Management, filter on the workspace's managed resource group and group by
data-product. That's invoiced CHF per product. - Databricks charges: take the invoiced CHF on the Databricks meters of that workspace resource for the same month. Multiply it by each product's
sharefor the sameworkspace_id. The numeric workspace ID is theadb-<id>part of the workspace URL, so each Azure resource maps to exactly one ID. - Sum both parts per workspace, then across workspaces if you want one number per product. What stays untagged (
shared) is platform cost. Report it as its own line; don't spread it silently.
Using a share instead of list_usd takes care of currency and negotiated discounts, if two assumptions hold. The shares always add up to 1, so the total proves nothing. Check the assumptions against independent data:
- Same usage, same period. Compare
SUM(dbus)per workspace and month with the DBU quantity on that workspace's Databricks meters in the export. A gap of more than a few percent means the periods don't line up (for example, day boundaries in different time zones), or usage is missing on one side. - Uniform discount. Run the query grouped by
sku_name. Divide each SKU group's invoiced CHF by itslist_usd. If the rates differ by more than a few percent, do step 2 per SKU group.
Neither check tells you whether the tags are right. Watch the shared line: if it grows from month to month, untagged compute grows with it.
Governed tags and domains
Unity Catalog has a second tag system for governance. Governed tags come with a tag policy that enforces how a tag can be used. They apply to Unity Catalog objects such as tables and catalogs, and to workspace objects such as dashboards and notebooks. Domains group data products and assets by governed tags, at account level.
This is the Databricks counterpart of Fabric tags and domains: discovery and governance. The documentation I read describes them for classification and access control and doesn't mention cost data. The compute tags above are the ones that reach cost data. I haven't tested whether governed tags show up in system.billing.usage or in the Cost Management export. The documentation names preview requirements for domains, so check their status before you build on them.
Fabric
Azure tags on the capacity
A Fabric capacity (Microsoft.Fabric/capacities) is an ARM resource, and its tags reach Cost Management like any other. But the capacity is the smallest unit of cost Azure knows about: all workspaces on it share one invoice line. If finance needs a clean split, separate capacities per cost center are the simplest answer.
Fabric tags in the tenant
Fabric tags launched in public preview. The current overview (last updated March 2026) no longer carries a preview label. Limits and APIs in this area still change, so check the linked pages before you build on them.
Fabric admins define tenant-level tags, Fabric or domain admins domain-level tags (max. 10,000 per tenant, names up to 40 characters). Workspace admins apply them to workspaces, users with Write or Contributor permissions to items. They power search, OneLake catalog filters and lineage views. The scanner API returns tag IDs per item and workspace.
Microsoft calls workspace tags useful for cost attribution, and they are, but as an input. They label which workspace belongs to which product. They don't split the bill.
Fabric tags don't reach Azure billing data. To get cost by Fabric tag, read the tags through the scanner API and use them in the attribution step.
Splitting cost below the capacity
If one capacity serves several products, you need usage data from inside Fabric. The Capacity Metrics app shows consumption in capacity unit seconds (CU(s)) per workspace and per item. You must be a capacity admin to install and view it. The compute page covers about the last two weeks. The item history page covers 30 days and was in preview when I read about it. For a monthly allocation, you have to store the data yourself.
An allocation would work like the DBU share: map each workspace to a product (workspace tags read through the scanner API are one way), calculate each product's share of CU(s) within a capacity, and apply it to the capacity's invoiced CHF. I haven't built or tested this. Decide first how to treat unused capacity. It is cost too, and a pure CU share spreads it over all products.
Ready-made option: Fabric Cost Analysis
Fabric Cost Analysis (FCA) is a solution accelerator in the fabric-toolbox repository, and the Fabric counterpart of the dashboard from part 2. It is built in Fabric. Pipelines and Notebooks extract Azure cost data in FOCUS format into a Lakehouse, and a Direct Lake semantic model feeds Power BI reports. It shows Fabric costs only, for example per capacity, per category and resource, and for reservations and quotas.
Two things to know. The README states that it is not an official Microsoft product and comes without official support. It also doesn't mention tags or an allocation per workspace, so a split per data product would be your own extension.
Comparison table
| Aspect | Azure tags (generic) | Databricks custom tags | Databricks governed tags | Fabric capacity (Azure tags) | Fabric tags |
|---|---|---|---|---|---|
| Format | key = value | key = value | key with allowed values | key = value | label only |
| Defined by | Anyone with write rights | Workspace users and admins, policies | Tag policy | Anyone with write rights on capacity | Fabric or domain admins |
| Applied to | Azure resources | Workspace, cluster, job, pool, SQL warehouse | Unity Catalog and workspace objects | Capacity | Items, workspaces |
| Max per object | 50 | Shares the 50 on the VM | Not checked | 50 | 10 (item and workspace counted separately) |
| Visible in Azure Cost Management | Yes | Yes, via VM tags (classic compute) | Not documented | Yes | No |
| Visible in platform billing | n/a | system.billing.usage (DBUs; list price in USD via list_prices) | Not documented | Capacity Metrics app (no tags) | Scanner API only |
| Enforcement | Azure Policy, IaC | Compute policies | Tag policies | Azure Policy, IaC | Admin-curated list |
| Main purpose | Cost, ownership, ITSM | Cost per workload or product | Discovery (domains), classification, access control | Cost per capacity | Discovery, governance; input for own cost allocation |
Conclusion
Start from the question, not the tag. The next time someone proposes a new tag, ask them which report, policy or process will read it. If they can't name one, the answer is no. If they can, that reader already tells you the key, the allowed values and where to enforce it.
Further Readings
- Azure Databricks: Use tags to attribute and track usage
- Azure Databricks: Billable usage system table reference
- Azure Databricks: Tag compute and workloads for cost attribution
- Azure Databricks: Governed tags
- Azure Databricks: Discover page, domains, and subdomains
- Microsoft Fabric: Tags in Microsoft Fabric
- Microsoft Fabric: Create and manage a set of tags
- Microsoft Fabric: What is the Microsoft Fabric Capacity Metrics app?
- Microsoft Learn: Allocate costs
- Microsoft Learn: FinOps Framework: Allocation
- Microsoft Learn: FinOps hubs overview
- GitHub: Fabric Cost Analysis
- Blog: Controlling Databricks Costs on Azure, part 2: building the dashboard