Controlling Databricks Costs on Azure

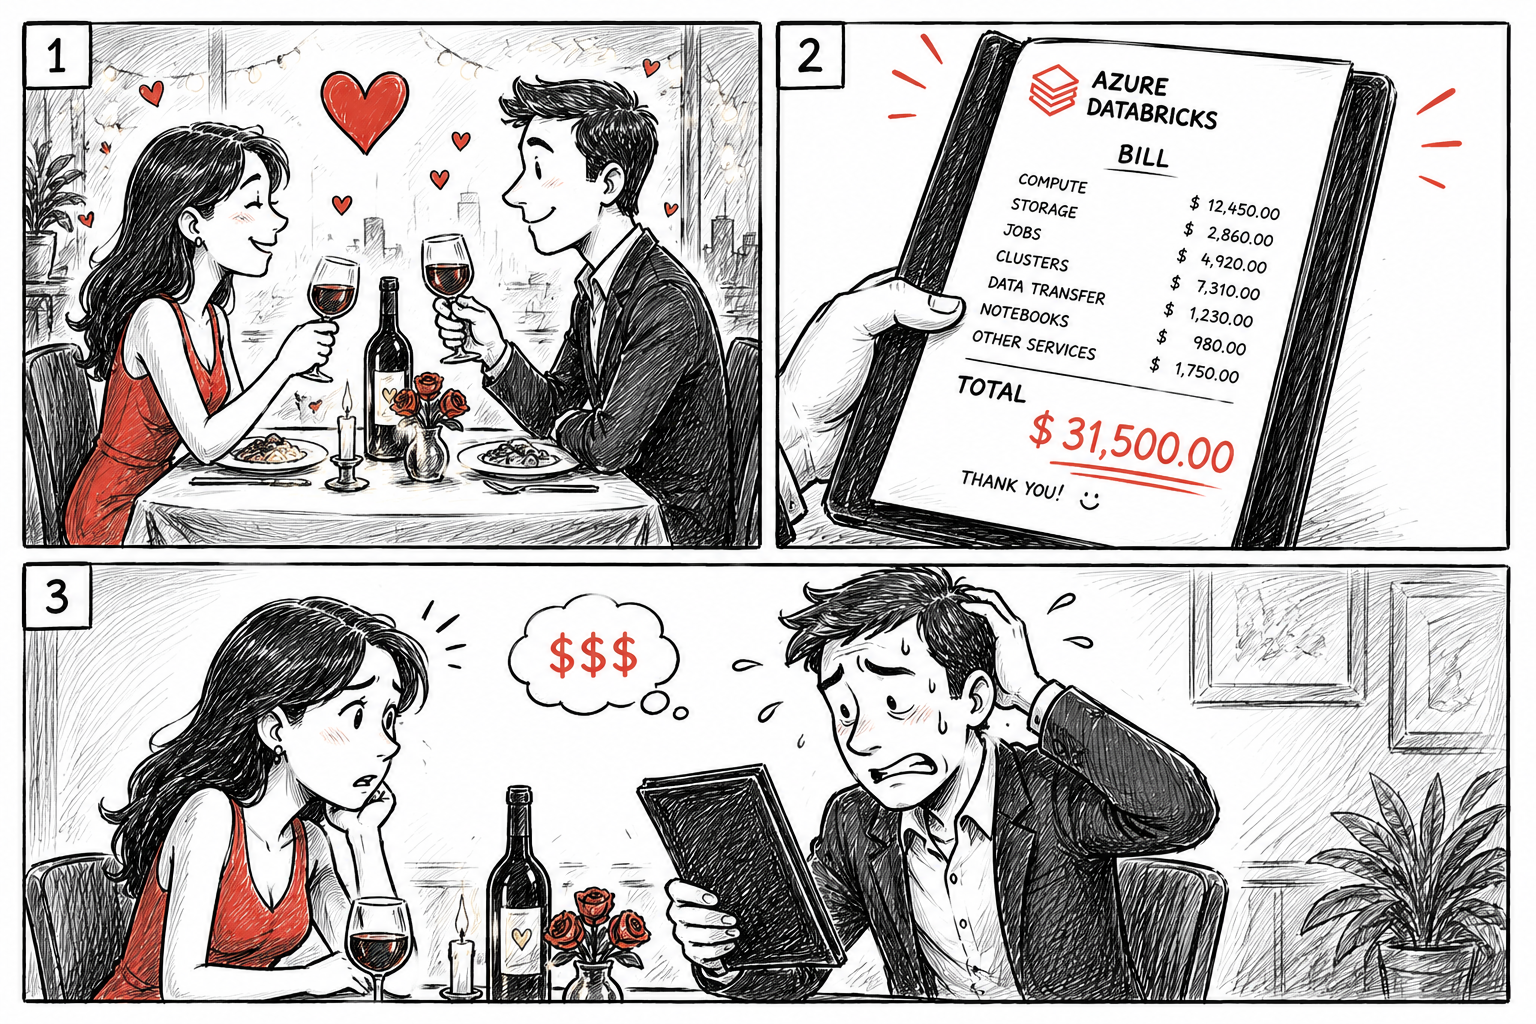
No one likes surprises on the bill. Whether it is at a restaurant with your date or in a company setting, an unexpectedly high invoice can quickly put us in unnecessary trouble. Explaining to leadership why costs suddenly went up can be okay when it was a conscious decision, but not when something was simply overlooked. That is exactly one of the biggest challenges for our Data Platform Engineering team: cloud and Databricks offer huge opportunities, but costs can rise sharply if you do not pay close attention. We often lack the clarity and early steering mechanisms needed to identify the main cost drivers and react in time. Our goal is to enable data teams to unlock the full potential of the platform without unpleasant end-of-month surprises from Finance. For us, success means no unexpected costs, cost awareness across all users, and clear, easy-to-manage processes for cost visibility and control. We evaluated multiple options and ultimately chose a solution that gives us this freedom without giving up control.
One Data Platform, but Without the "Spicy Bill"
Our data platform is built around Databricks as a central part of the architecture. Databricks is where we build experiments and MVPs, then move them into production. For experimentation, we use sandbox workspaces to speed up delivery. Now AI workloads are adding another layer. What we are currently missing:
- Transparency: We can see total cost, but not what drives it most. Without that, we cannot make targeted decisions to reduce spend.
- Proactive instead of reactive: Dashboards are useful, but we want early notifications so we can act in time.
- Cost awareness for users: People should understand cost, but that does not work when they cannot easily view it or receive notifications. It is like giving your kids a credit card and saying, "Use it, but not too much." Practical measures to build awareness include regular cost reports for all users and post-mortems on incurred costs. This is not about blame, it is about learning how to keep costs under control.
Cost Structure
Before we jump into solutions, we need one clear baseline: Azure Databricks cost is made of two parts.
- DBU cost (Databricks platform cost)
- Azure infrastructure cost (the underlying cloud resources)
In simple terms:
Total Azure Databricks cost = DBU cost + Azure infrastructure cost
DBU stands for Databricks Unit. It is Databricks' consumption metric and billing unit, measured by workload usage over time. DBU usage changes with workload type, runtime duration, cluster size, compute mode (for example serverless vs. classic), and selected instance profile.
The Azure infrastructure part covers the compute and storage resources that execute your workloads, for example general purpose compute, memory-optimized compute, disks, and networking. That is why cost spikes can have different root causes: DBU usage can increase, infrastructure usage can increase, or both.
To understand the effectively consumed cost in detail, Databricks System Tables are the key source. With Unity Catalog, Databricks provides system tables (for example system.billing.usage) that capture standardized usage and billing data, including DBU consumption by job, user, and data product. These tables are the technical foundation for granular cost visibility and for the control patterns described later.
Alternatives We Considered
1. Azure Cost Management only
Azure Cost Management lets you monitor spend with dashboards, alerts, and budgets. But there are three key drawbacks: first, data is often delayed by 8 to 24 hours, which makes fast reactions harder. Second, the information is quite coarse, usually limited to total cost by subscription, resource group, or service. A detailed breakdown by Databricks jobs, workloads, or users is not available. That can be enough for initial FinOps, but not for targeted optimization or root-cause analysis. Third, not all relevant costs are visible. If resources are spread across multiple subscriptions, you do not get all key costs in one view.
What we can see:
- Azure infrastructure cost for our data platform (including VM, storage account, ...)
- Azure Databricks cost (consumed DBUs)
What we cannot see:
- What cost sits behind DBUs (serverless vs. classic compute, AI, which jobs, which data products, which user caused which cost, ...)
- Cost from other providers in a multi-cloud setup
- A complete view of all relevant costs (for example across multiple subscriptions)
2. Databricks Dashboard
As an account admin, Databricks allows you to import a ready-made dashboard to analyze spending. Overall, this is well designed and allows us to break down costs by workspace, user, and other dimensions. The data is based on System Tables (system.billing.usage), which are refreshed hourly.
Pros:
- Quick to set up
- Deep insights into cost drivers, great for transparency
- Dashboards are GA and can be provisioned with Terraform
- Extendable with Azure cost data (and other cloud providers in multi-cloud scenarios)
- Users can review and understand their own costs, good for cost awareness
Cons:
- ClickOps by default (can be exported as JSON and re-provisioned via IaC)
- No proactive response by itself, someone still needs to monitor dashboards regularly
3. SQL Alert
Another option is using alerts. Here as well, we rely on System Tables to calculate cost. You can choose whether to alert on total spend or segment by workspace (for example sandbox vs. production), environment, or user. The main risk is receiving too many alerts. Once that happens, recipients start ignoring them, which causes more harm than value. That is why alert volume and threshold design are critical and need regular review. We run team feedback sessions to evaluate which alerts were helpful and which were noisy. Based on that, we adjust thresholds, frequency, and recipients, and sometimes consolidate multiple alerts. We also periodically verify whether each alert is actionable or too generic. This helps us avoid alert fatigue and keep only meaningful notifications.
It is also important not to be notified too late when a limit is reached (for example 90 percent in week one), because then there may not be enough time left to act. Right now, unlike Azure Budgets, there is no straightforward way to define one total budget and precise multi-threshold notifications in one place. The workaround is to create multiple alerts with different thresholds. Email messages are often not very helpful. The upside is that this approach is generally available and can be configured with Terraform.
Pros:
- Proactive monitoring using thresholds based on Databricks System Tables
- Flexible segmentation (overall, by workspace, by environment, or by user)
- Generally available and can be set up with Terraform
- Can be continuously tuned through team feedback cycles
Cons:
- High risk of alert fatigue if thresholds and frequency are not tuned well
- No single native total-budget workflow with clean multi-threshold notification logic like Azure Budgets
- Requires multiple alerts as a workaround, which increases operational complexity
- Email notifications are often too generic and not actionable enough
4. Databricks budget control
Finally, we looked at Databricks' newest cost-governance feature: Budget Control (Public Preview). Budget Control currently has limited Terraform support. It can create basic controls that group cost by workspace or day and trigger an alert at threshold. But if you want grouping by user or user group, Terraform support is missing. Another useful feature is spend blocking. Unfortunately, this is currently available only for Genie. I hope Databricks expands this. If you still want to use these capabilities, you need ClickOps, meaning manual setup in the UI. In the UI, you can define budgets per user or user group, and if needed set a shared-user threshold. To determine thresholds, we reviewed historical cost and defined an initial value. ClickOps is not my preferred approach, but it can be a temporary alternative until IaC is ready. The important part is to record this as technical debt and be ready to migrate as soon as IaC support catches up.
Pros:
- Budget Control with alerting lets us react proactively to cost.
- It also includes visualization to understand cost quickly and supports user cost awareness.
Cons:
- Still in Public Preview with reduced functionality
- No per-user or per-user-group alerting via IaC
- Directly notifying individual users is not supported; instead, a predefined email group is notified
- Spend blocking is available only for Genie
- Limited flexibility (workspace and tags only)
Our Decision
We did not choose a single solution. Instead, we combined multiple approaches to capture each one’s strengths: dashboards for visibility, alerts for proactive management, and budget controls for governance and steering. This gives us a solid balance between transparency, responsiveness, and control without losing flexibility. To make this work, we import Azure infrastructure cost daily into a dedicated storage account. Databricks can access this data so we can include it in our dashboards. The data is not hourly fresh, but acceptable for our use case. We review cost each sprint and define actions for optimization or deeper investigation. To react proactively, we use SQL alerts. They trigger when yesterday’s cost is above the median of the last 30 days. We configured them for sandbox vs. production and by environment. When an alert triggers, we know we need to inspect dashboard details to check whether features are being used inefficiently and whether action is required. If an alert fires too often, we tune it. To be informed about user-specific cost overruns, we deliberately use Budget Control. SQL alerts cannot send clear, direct notifications per user. They only indicate that some user exceeded a threshold, not exactly who in a user-targeted notification flow. Budget Control supports this, but currently only via manual UI setup. We accept this limitation as technical debt until Terraform support is available.
To avoid ignored alerts (alert fatigue), we introduced a simple process: we regularly review all triggered alerts as a team. We discuss whether thresholds are too high or too low, whether notification frequency is appropriate, and which alerts were actually useful. Based on this feedback, we adjust thresholds and frequency or disable unnecessary alerts. This helps ensure we do not miss critical signals and keep alerts relevant. Finding the right balance is not trivial and requires continuous iteration. Lastly, we do not want to rely only on manual reaction. We want spending to stop once a user exceeds a defined threshold. After that, we review the case with the user and can override the limit individually, for example from $100 to $300. Since maintenance overhead grows quickly with many users, it makes sense to define thresholds not only per user but also by user group. In practice, this lets us assign different budgets to different roles, such as data engineers, data scientists, data analysts, or beta testers. For example, data engineers might have a monthly threshold of $500, data analysts $300, and beta testers a higher flexible limit. These limits are agreed with the team based on responsibility and need, and can be adjusted as needed. When a group threshold is reached, notifications can be sent to group members and the platform team, or if necessary additional spend can be blocked until clarification. This lets us align policy to real role-specific requirements and make cost control both fairer and more efficient. This is especially relevant because Genie becomes billable after July 31 (originally July 7, then postponed by Databricks to July 31).
Next Blog Post
In the next blog post, I will walk through the concrete implementations in detail and explain what I had to watch out for. Stay tuned. If you are facing similar challenges, let me know how you are handling them and what worked well, and what did not.