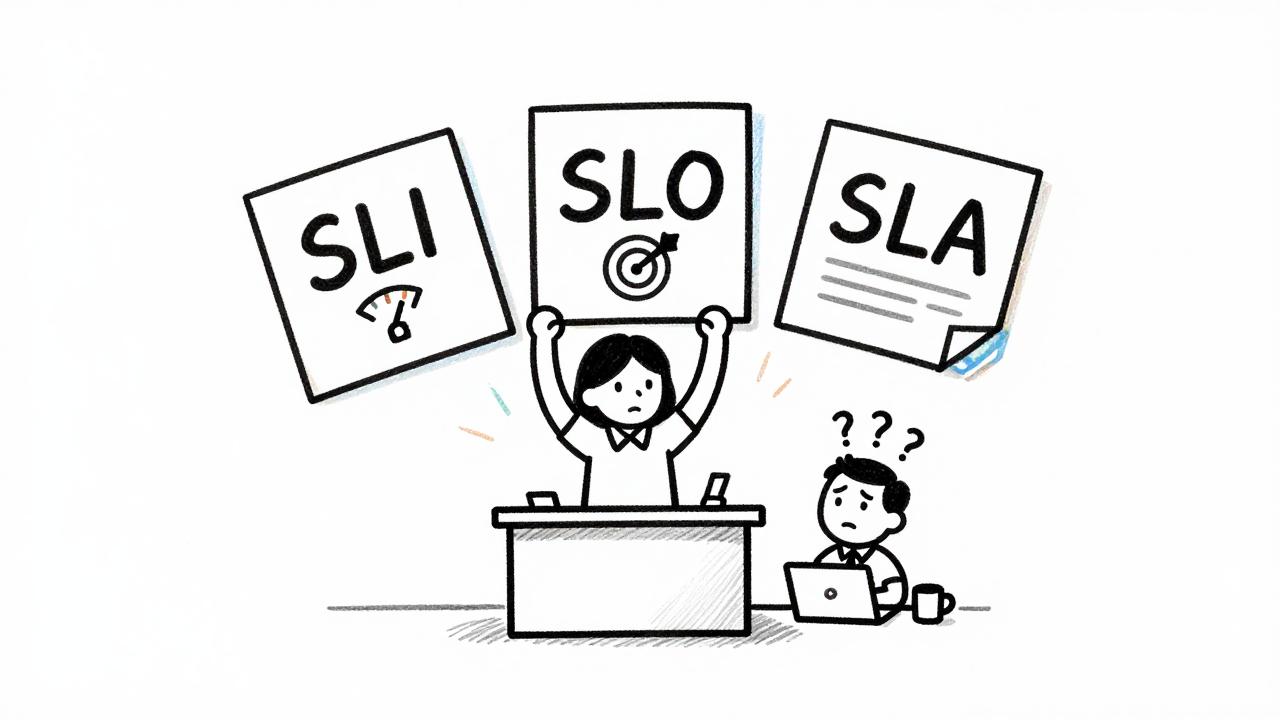
SLI, SLO, SLA: making reliability measurable on Azure

Tom, a platform engineer, is in a meeting when the business puts its demand on the table: the data platform should be 99.9% available. Rather than challenge the number with technical terms, Tom asks: "What do you rely on the platform to deliver, and when do you need it?"
"The finance report needs to be ready by 07:00 so the team can make its daily decisions," the business explains. Tom follows up: "And what happens if it's late, or the numbers aren't up to date?" The answer makes the real need clear: a running cluster is not enough. The report must be available on time, with data fresh enough to trust.
When a data platform becomes business critical, "it somehow runs" stops being enough. The business wants to know: when is the data there, how reliable are the pipelines, can I trust the numbers, and how fast are the reports? This is where service level indicators (SLIs), service level objectives (SLOs) and service level agreements (SLAs) come in, ideally combined with error budgets and good visualization in Azure.
An SLI is what you measure, an SLO is your internal target, and an SLA is what you promise. Keep the SLO stricter than the SLA, and use the error budget to decide when to focus more on reliability.
In this post you will see:
- What SLI, SLO and SLA are, and why you need them
- How to define them for an Azure data platform, step by step
- How to choose data sources for SLIs and visualize them in Azure workbooks
- How error budgets fit into the picture
- How to model more quality dimensions, such as performance, security and data quality, as SLIs
1. SLI, SLO, SLA: what is what?
The concept comes from Site Reliability Engineering (SRE) and applies in any cloud. Here I show how I put it into practice on Azure.
Service level indicator (SLI)
An SLI is a concrete measurement that describes the quality of a service from the user's view. Examples for an Azure data platform:
- The percentage of successful pipeline or job runs over the last 30 days (e.g., in Databricks or Fabric)
- The 95th percentile of the duration of a daily pipeline
- The data freshness of a lakehouse, in minutes
- The share of days on which a specific report is available by 07:00
In short: an SLI answers the question "What do we measure?"
Service level objective (SLO)
An SLO is a target value for an SLI. It describes the quality level you want to reach. Examples:
- "At least 99.5% of all orchestrated pipeline runs succeed per 30 days."
- "On at least 95% of days, the finance report is available by 07:00."
- "For at least 99% of the time, the data in the table
Fact_Salesis younger than two hours."
In short: an SLO answers the question "What quality target does our metric have?"
Service level agreement (SLA)
An SLA is a contractual promise to a customer or an internal business unit. It often builds on SLOs, but it is legally or commercially relevant and includes consequences if you miss it. Examples:
- "We guarantee 99.9% availability of the reporting front end per calendar month, otherwise there is a credit."
- "Daily finance reports are delivered by 08:00. If we are late, we provide manual reports or replacement deliveries."
In short: an SLA answers the question "What do we promise by contract, and what happens if we break it?"
Two analogies
Take the Swiss railways SBB (hypothetical numbers). The SLI is the share of trains that arrive less than three minutes late. Today that is 91%. The SLO is the internal target of 95% punctuality. The SLA is the contract with the customer: if the train is late, you get money back.
Now the pizza courier. The SLI is the delivery time per order. The SLO says: 95% of pizzas arrive in under 30 minutes. The SLA says: if it takes longer, the pizza is free.
Error budget: the fuel tank
An SLO of 99.9% also means that 0.1% failure is allowed. Over 30 days that is roughly 43 minutes of downtime. That is your tank. As long as it isn't empty, you can ship and experiment. Once it is empty, you stop features and focus on stability. Move the SLO and the downtime below and watch the tank.
2. Why this matters for an Azure data platform
A modern data platform supports reporting, planning, analytics and operational decisions. SLIs, SLOs and SLAs help teams:
- Set shared expectations. The business and engineering teams agree on when data is due, how fresh it must be, and what quality is acceptable.
- Make evidence-based decisions. Measured results replace guesswork, while the error budget helps teams decide when to slow changes and focus on reliability.
- Make realistic commitments. Once performance is measured and understood, teams can set an SLA with a clear scope and target.
3. Step by step: defining SLIs and SLOs for an Azure data platform
Tom wants to get concrete. Here are the seven steps I would take.
Step 1: Identify critical flows
Instead of talking about "the platform", define concrete user journeys:
- "The daily finance report is available in the Power BI workspace at 07:00."
- "Data scientists get hourly updated feature data in Databricks or Fabric."
- "Self-service analysts can work performantly on the lakehouse between 08:00 and 18:00."
Aim for three to ten business-critical flows.
Step 2: Collect business requirements
For each flow, clarify with the business:
- How critical is the flow (high, medium, low)?
- By when must the data be available, for example 07:00?
- How often may it fail before the business really suffers?
- Which quality dimensions matter most? Availability, latency or deadline, data freshness, data quality, and maybe security or compliance.
A simple table in a spreadsheet or wiki is enough at the start.
Step 3: Define the SLIs
Pick one to three SLIs per flow, not twenty. Examples:
Pipeline success rate (reliability)
SLIPipelineSuccess = (successful pipeline runs ÷ scheduled pipeline runs) × 100%
Measured over a rolling window, for example 30 days.
End-to-end latency or deadline met
SLIDeadline = (days the "Finance_Daily" run finishes before its deadline ÷ total days) × 100%
Data freshness
SLIDataFreshness = (time the data is no older than X ÷ total time) × 100%
For example, the data in Fact_Sales is younger than two hours for at least 99% of the time.
The technical base in Azure:
- Azure Monitor and Log Analytics for pipelines, jobs and errors
- Databricks logs or the Databricks Jobs API
- Power BI tenant logs or the Power BI REST API
- Custom logs, for example from freshness checks
Step 4: Set the SLOs
Now the metrics become targets:
SLI_PipelineSuccess: at least 99.5% successful runs per 30 days.SLI_Deadline(finance report): on at least 95% of days, the report is available by 07:00.SLI_DataFreshness(near real time): for at least 99% of the time, the data is not older than 15 minutes.
Two rules help. Be ambitious but reachable. And start with conservative values, then tighten them once the platform is stable.
Step 5: Measure your SLIs in Azure
First, identify where each measurement comes from and make sure it is recorded consistently:
- Pipeline or job runs
- Your own freshness checks: record the check time and the newest data timestamp in a control table or monitoring service
- Security and compliance: Azure Policy and Microsoft Defender for Cloud reports
For each SLI, agree on the source, the reporting period, and how missing or late records are counted. For example, a pipeline success rate needs the number of successful runs and the total number of scheduled runs in the period. A deadline SLI needs one result per expected reporting day, including days when no successful run completed. A freshness SLI needs regular checks comparing the current time with the newest timestamp in the data.
Azure Monitor and Log Analytics can collect and report on many of these signals. The exact setup depends on the Azure service, the diagnostic settings, and the schema available in your workspace. This post focuses on defining the measurements; it does not prescribe KQL or a specific query implementation.
Step 6: Define and use the error budget
An error budget is the allowed room for failure within a period. Here is an example in runs:
- SLO: 99.5% pipeline success rate per month
- Period: 30 days
- Expected runs: 3,000
- Error budget in runs: 0.5% of 3,000, which is 15 allowed failed runs per month
You can show this as a simple status:
- Less than 50% of the budget used: green
- 50% to 90%: yellow
- 90% or more: red
Agree on an early warning point. As the budget starts running low, investigate the causes and reduce risky changes so you can improve reliability before the budget is exhausted.
Trade-offs
A strict SLO such as 99.99% leaves about four minutes of error budget per 30 days, so every deployment becomes a risk. A looser SLO such as 99.5% leaves room for change, but the business may find it too weak. Choose a target deliberately and revisit it as you learn more about the service.
Step 7: Derive an SLA only if needed
If you need SLAs:
- Use only well-understood, stable SLOs.
- Set the SLA slightly looser than the internal SLO, so you have a buffer. For example, SLO 99.5% and SLA 99.0%.
- Document the scope (which reports, regions and times), the measurement method (source, aggregation and period) and the consequences (credits, escalation, special measures).
Also keep in mind the SLAs of the Azure services you build on, because they limit what you can promise yourself.
4. Azure workbooks: visualizing SLIs
A number hidden in a log or report convinces nobody. Tom builds an Azure Monitor workbook around the SLI measurements, so the business sees the same numbers he does. You can do this directly in the Azure Portal, without a separate BI tool.
4.1 Plan an Azure workbook
The exact workbook setup depends on where each signal is stored, so this section focuses on what to show rather than providing a portal walkthrough. At a high level, connect the relevant data source, add the measurements for each SLI, choose an appropriate visual, and save or share the workbook. If the source is Log Analytics, the workbook will need a query that matches the tables and columns in your workspace; that implementation is outside the scope of this post.
4.2 Example visuals
SLI pipeline success rate as a KPI tile
Show the current pipeline success rate, the SLO target, and whether the target was met.
- Visual type: Tile
- Main value: pipeline success rate
- Subtitle: SLO target
- Status: met or not met
- Conditional formatting: "Met" gets a green background, anything else red
SLI freshness as a time chart with a threshold
- Show: freshness over time
- Visual type: Time chart
- X axis: check time; Y axis: data age
- Threshold line: for example 120 minutes
Deadline as a grid with colors
- Show: whether the report met its deadline each day
- Visual type: Grid
- Columns: report date, actual completion time, deadline, and whether it was met
- Conditional formatting: met in green, missed in red
Error budget as a tile
- Visual type: Tiles
- Value: percentage of the error budget used
- Subtitle: actual failures compared with allowed failures
- Traffic-light colors by percentage range
5. Do you always need SLIs for monitoring?
No. You can monitor systems without SLIs, but SLIs make the results easier to interpret.
- Without SLIs: you see metrics such as CPU, errors and latency, but it can be hard to tell when users are affected.
- With SLIs: you get clear, business-relevant statements. "The finance report was on time on 97% of the days last month." "The data was fresh enough 99.2% of the time."
My practical approach: build at least one SLO or reliability workbook based on SLIs. Keep detailed technical metrics in separate engineering monitoring views.
6. Beyond availability: performance, security and data quality
Tom's business partner asks: "Can we trust the numbers?" Availability alone cannot answer that. A report can arrive on time and still contain incomplete or invalid data. To make trust measurable, agree with the business on what "correct enough" means, then track checks for those expectations as data quality SLIs. Performance and security SLIs answer other important questions: is the service responsive, and are its resources protected?
6.1 Performance SLIs
Report performance
SLI_ReportLatency = share of Power BI queries answered in under 5 seconds (for example over 30 days)
SLO: at least 95% of queries under 5 seconds
Batch performance
SLI_BatchDuration = share of runs of the pipeline "Sales_Daily" with a duration of 60 minutes or less
SLO: at least 99% of runs within 60 minutes
6.2 Security and compliance SLIs
Use these only where you can measure continuously and automatically.
Policy compliance of storage
SLI_StorageCompliance = share of data storage resources that meet all defined security and compliance policies
SLO: at least 99% of production storage is policy compliant
Critical security findings
SLI_CriticalFindings = number of high or critical security findings that are older than 7 days
SLO: zero critical findings older than 7 days
The data source is Azure Policy and Microsoft Defender for Cloud, with the results sent to Log Analytics.
6.3 Data quality SLIs
These checks connect the metrics to the question about trust: they test whether the data meets explicit expectations the business relies on. For example, completeness checks whether all expected data arrived; mandatory-field checks catch missing values; uniqueness checks catch duplicate business keys. They do not prove that every value is factually correct, so choose rules that reflect the meaning and decisions behind each report.
Completeness
SLI_Completeness_Sales = share of days in the month on which Fact_Sales is fully loaded (expected rows and partitions)
SLO: at least 99% of days with complete sales data
Mandatory fields
SLI_RowCompleteness = share of rows in which the mandatory fields (CustomerId, ProductId, Amount) are not NULL
SLO: at least 99.8%
Key uniqueness (no duplicates)
SLI_KeyUniqueness = share of days on which there are no duplicates in the business key
SLO: at least 99.9% of days without duplicates
The measurements usually come from a data quality framework, dbt tests or your own checks. Record the results in a consistent place, such as Log Analytics or a control table, and aggregate them over the period defined for the SLI. Review failed checks with the data owner to determine whether they indicate a real issue and what action is needed.
Conclusion
Three mistakes cost the most:
- An SLO that equals the SLA. You have no buffer, and you break the contract before you can react.
- An SLO without consequences. If a shrinking error budget does not change priorities, the SLO is just a number on the wall.
- Measuring from the inside instead of the user's view. A healthy cluster does not help if the report is late or its data is incomplete.
The same SLI measurements can also drive alerts and serve as the foundation for a health model that assesses the state of the whole platform.
And Tom?
At the next meeting, Tom puts the numbers on the screen. "Our SLA is 99.9% availability over the month. Our internal SLO is 99.95%, and last month actual availability was 99.98%. Separately, the finance report was ready by 07:00 on all 20 business days. If our error budget starts running low, we'll investigate and reduce risky changes before it runs out."
The business manager nods. They now understand what the 99.9% applies to, how it differs from the team's stricter target, and whether the service is meeting its promise.
Further reading
- Create service level indicators in Azure Monitor (Microsoft Learn)
- Architecture strategies for defining reliability targets (Azure Well-Architected Framework)
- Reliability design principles (Azure Well-Architected Framework)
- Azure reliability documentation (Microsoft Learn)
- The Art of Site Reliability Engineering (SRE) with Azure: Building and Deploying Applications That Endure
- Site Reliability Engineering, 2nd Edition
- Site Reliability Engineering Essentials
- Site Reliability Engineering on AWS
- Azure Monitor SLIs on Managed Prometheus: the bits the docs don't tell you
- azure-sre-observability (GitHub)